At most mine sites, operations data sits somewhere between a spreadsheet and a team meeting rarely happens. The numbers, when examined honestly, tell a story that is impossible to ignore: on identical equipment, operating identical material, the dig rate can exceed 30% in productive output.
On a 996B truck fleet, analysis of 62 operators revealed the top 15 averaged 5,787 tonnes per effective hour: 12% ahead of the remaining 47, who averaged 5,295 tpeh. That gap, compounded across thousands of hours per machine per year, translates directly into foregone revenue and inflated unit costs.
Lost Tonnes are a Silent Drain
Variability rarely triggers an alarm. There is no red light when a truck moves 400 fewer tonnes per shift than it could. Yet that consistent shortfall multiplied across shifts, across operators, and across machines accumulates into a revenue loss that dwarfs most other controllable cost categories at a mine site.
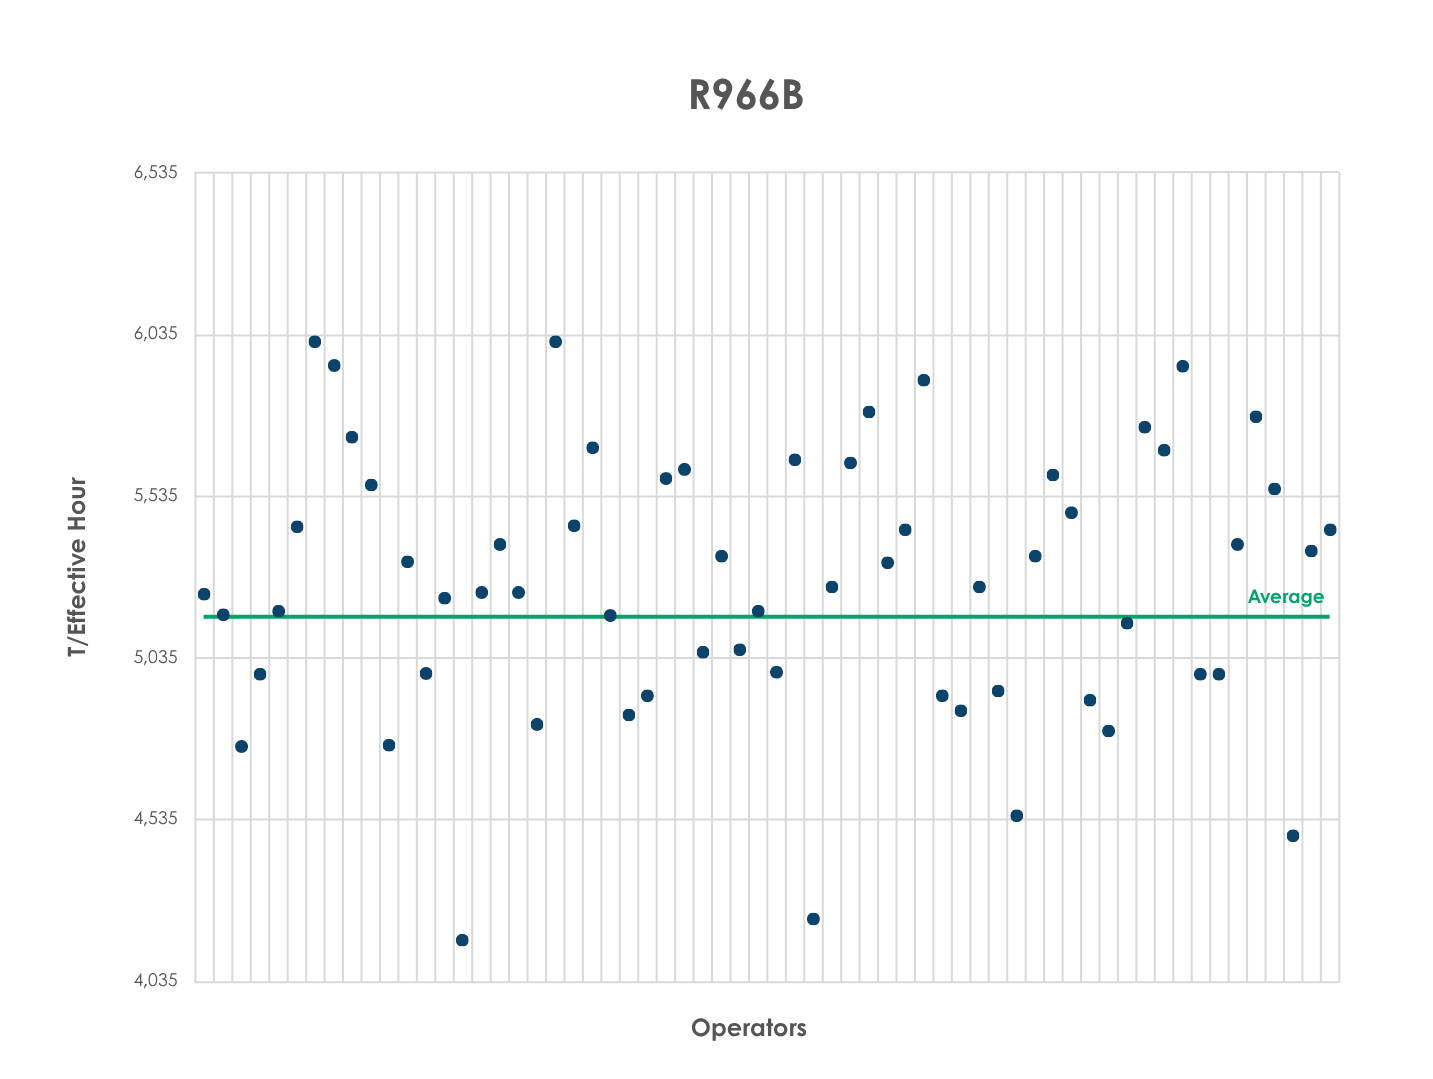
When the top 24% of operators generate 22% of all tonnes, the numbers look deceptively close to average. But that aggregated view conceals the real story: what would the fleet produce if every operator performed at the level the best already demonstrate is achievable?
“The ceiling isn’t theoretical. The top operators prove every shift what the machine is actually capable of” – David O’Rourke, Director of eXcellerate
Variability Inflates Cost Per Tonne
Higher output per effective hour directly compresses unit cost. When a machine produces fewer tonnes for the same hours of operation, maintenance, fuel, labour, and capital costs are spread across a smaller denominator. In high-capital equipment categories like 996B-class trucks, even marginal improvements in throughput have outsized effects on the cost structure of the entire operation.
The inverse is equally true: tolerating wide operator variability is an active choice to accept a higher cost per tonne than the operation needs to carry.
A single 996B running at average output, rather than the top 15 levels, foregoes roughly 492tpeh. Over a 6,000-hour annual productive schedule, that is approximately 2.95 million tonnes of unrealised capacity per machine.
Operators Deserve Better Feedback
Fleet management systems generate terabytes of operational data per shift: payload, cycle time, speed profiles, queue duration, all recorded. Yet that data rarely reaches the operator in the cab as fair, actionable feedback that they can actually use to change their behaviour.
The most common failure mode is raw tonnes as the main metric. Without like-for-like normalisation, raw tonnes overlook good operators working hard routes and disguise poor execution on easy ones. The result is a feedback system that erodes trust rather than building it.
How to Solve the Operation Variability
Developed over two decades, iXcede extracts mine site operational data, cleanses it and uses a proprietary like-for-like model that accounts for the actual conditions each operator faces. Leveraging this information, the app delivers the targeted insights operators require to work at their best
The results speak for themselves: record production milestones achieved in less than 6 months, and improvement initiatives identified in the hundreds of millions. All this generated not by buying new equipment, but by supporting operators to close the production gap.
Request a demo and see how iXcede shows you exactly where your fleet sits, what’s driving the gap, and what it would take to close it.